VFV and VSP are low-cost Vanguard ETFs designed to track the S&P 500, mirroring the returns of the 500 largest companies traded on US stock exchanges, making them suitable for long-term investors with a bullish view on the American equity market.
The major difference between VFV and VSP is that while VFV offers direct exposure to the performance of the S&P 500, VSP is hedged to the Canadian Dollar, providing investors with a degree of protection from foreign exchange (FX) fluctuations in the Canadian Dollar.
In this blog post, we will compare VFV vs VSP, evaluating their performance, expense ratios, risk factors, and suitability for different investment strategies. We will provide a comprehensive understanding of these two Vanguard ETFs to help you make informed investment decisions.
VFV and VSP: A Quick Comparison
Features | Vanguard S&P 500 Index ETF (VFV) | Vanguard S&P 500 Index ETF CAD-hedged (VSP) |
Ticker | VFV.TO | VSP.TO |
Exchange | TSX | TSX |
Inception date | 11/02/2012 | 11/02/2012 |
Asset class | Global Equity | US Equity |
Management fee | 0.08% | 0.08% |
MER | 0.09% | 0.09% |
Dividend Yield | 1.26% | 1.22% |
10 Year Performance | 307.04% | 193.87% |
Vanguard S&P 500 Index ETF (VFV)
Launched in 2012, the Vanguard S&P 500 Index ETF (VFV) tracks the performance of the broad US S&P 500 equity index, providing investors with indirect exposure to the growth and returns of the 500 most valuable companies in America.
As a long-term core holding, VFV allows investors to capture the natural upward movement of the US economy over time without the need for active participation, such as frequent buying and selling.
Rated as medium-risk, VFV comprises 100% equities, classified as ‘risk assets’. For investors seeking an investment that taps into the potential of the American economy, VFV offers a solid option, historically delivering strong capital gains with modest dividends paid every quarter.
Since its inception, VFV has delivered 15.53% annualized growth, with a 5-year annual performance of 11.77% (as of February 17, 2024). As of the same date, VFV had total assets of $9 billion.
Vanguard S&P 500 Index ETF CAD-hedged (VSP)
Established in 2012, the Vanguard S&P 500 Index ETF CAD-hedged (VSP) tracks the S&P 500, similar to VFV. However, VSP distinguishes itself by protecting investors from large fluctuations in the USD-CAD currency pair.
For investors seeking a lower-risk investment while still aiming to capture the growth of the American economy (e.g., retirees), VSP presents a potentially suitable option.
If you are wondering why there is a variance between the VSP and VFV returns despite following the same benchmark and having similar MERs, the answer lies in the CAD-hedged component of the VSP ETF.
Since its inception, VSP has delivered 11.36% annualized growth, including 9.25% in the last 5 years, with assets under management totalling $2.37 billion (as of February 17, 2024).
VFV vs VSP: Performance & Returns
When it comes to the performance and returns of the S&P 500 ETFs, VFV is an ideal long-term investment. Canadian investors who desire higher capital gains will prefer VFV.
Unlike VSP, VFV has delivered excellent returns and performed well since its inception. Even when the world is currently facing a market downturn in 2022, VFV has powered through and outperformed VSP.
USD is still the strongest currency in the world, and CAD is struggling to keep up. As a CAD-hedged ETF, VSP protects you against the falling USD, affecting its performance against VFV.
VFV vs VSP: Performance Against The S&P 500
Suppose you are looking for an ETF that generates similar exposure and returns as the S&P 500. In that case, you should consider the VFV as it is a better choice than VSP.
ETFs are designed to replicate the performance of the S&P 500. VFV excellently replicates and outperforms the S&P 500 by 97.65% since its inception. However, within the same time frame, VSP underperforms the S&P 500 by 17.4%.
VFV vs VSP: Management Expense Ratio
Management Expense Ratio (MER) is an annual fee you pay to buy ETF. It includes the management fee, operating expenses, and any other expenses.
VFV and VSP have the same MER of 0.09%. When you make an initial investment of $10,000, your MER for the year is $9.
These two ETFs offer competitively low MER compared to mutual funds that can charge you $200 annually.
Also, the lower your MER fees, the more returns you can keep.
VFV vs VSP: Dividend Yield
The underlying stocks of VFV and VSP pay dividends. These dividends are collected and distributed to their shareholders on a pro-rata basis.
VFV has a 12-month distribution yield of 1.34%, while VSP has a 12-month yield of 1.46%. Therefore, VSP earns you a higher dividend return.
VFV vs VSP: Allocation & Exposure
VFV and VSP have similar sector exposure. They are both 100% focused on the equity asset class.
Sector | Fund |
Information Technology | 29.09% |
Financials | 12.9% |
Health Care | 12.7% |
Consumer Discretionary | 10.73% |
Communication Services | 8.61% |
Industrials | 8.29% |
Consumer Staples | 6.3% |
Energy | 4.1% |
Materials | 2.44% |
Real Estate | 2.43% |
Utilities | 2.3% |
Total | 100.0% |
VFV vs VSP: ETF Provider
Vanguard Canada is one of the world’s biggest asset management companies. They provide easy access to product details and documentation on their website.
Also, vanguard provides a wide range of ETFs that can meet your investment needs. They are a great and reliable ETF provider.
VFV vs VSP: Holdings
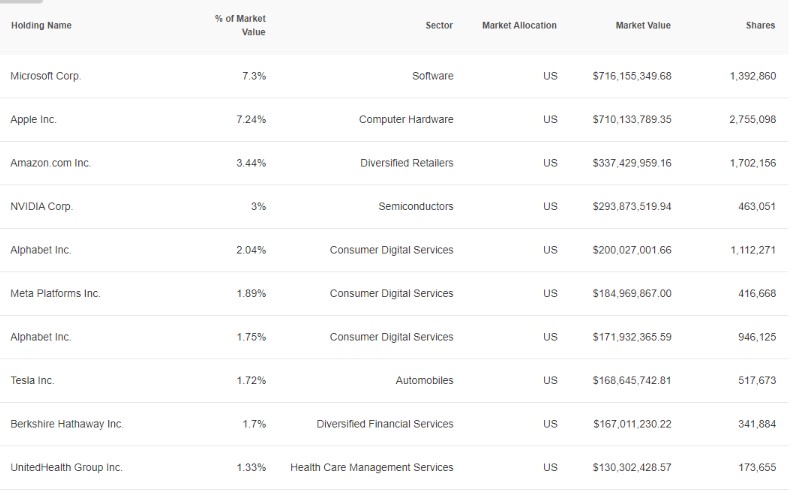
VFV and VSP have similar holdings.

VFV vs VSP: Which Is Better?
Vanguard S&P 500 Index ETF (VFV) and Vanguard S&P 500 Index ETF (CAD-hedged) (VSP) are both listed on the Toronto Stock Exchange and can be bought in CAD dollars.
The core difference between these two ETFs is their hedging strategy. The VSP is the hedged version of VFV. VSP is ideal for any investor who believes the Canadian dollar will appreciate in value relative to the USD dollar.
When you buy S&P 500 ETFs that hold U.S. companies, you gain exposure to the U.S. companies and the CAD-USD currency fluctuations. The CAD-hedged ETF protects your returns from the negative impacts of fluctuations.
When the CAD dollar appreciates in value, your CAD-hedged ETF (VSP) offers higher returns. However, when the CAD dollar depreciates in value, an unhedged ETF (VFV) provides higher returns.
The better option between VFV and VSP depends on your outlook for the Canadian dollar relative to the US dollar.
If you believe the Canadian dollar will strengthen against the US dollar, then VSP (CAD-hedged ETF) may be preferable as it protects against currency fluctuations, potentially offering higher returns.
On the other hand, if you expect the Canadian dollar to weaken against the US dollar, VFV (unhedged ETF), could yield higher returns. Therefore, the choice between VFV and VSP hinges on your assessment of currency movements and your investment strategy.
Final Thoughts on Should I Buy VFV or VSP?
The similarities between VFV and VSP are evident in nearly all aspects. The core difference between the two ETFs is their respective hedging strategies.
VSP is the CAD-hedged version of VFV and is designed to protect you against the falling USD and CAD-USD fluctuations while providing exposure to the S&P 500 index ETF.
If you are looking for higher dividend income, VSP delivers excellently because VFV is ideal for long-term investment and offers better future returns.
However, VFV is a better investment considering its higher returns over different time horizons.
Ultimately, the choice is yours to decide between VFV vs VSP. My two favorite platforms to buy VFV or VSP are Wealthsimple Trade and Questrade. These trading platforms charge a $0 trade commission when you purchase ETFs.
FAQs on VFV vs VSP
Is VSP better than VFV?
While VSP and VFV are structurally similar and usually move in the same direction, keeping track of their differences is still essential. The major difference between these two ETFs is that while VSP is hedged for the Canadian Dollar (CAD), VFV is not.
Is VSP a good investment?
VSP is an excellent ETF that adds US exposure to your Canadian investment portfolio. It has a very low annual MER of 0.09% and pays quarterly distributions to its shareholders.


